Infographics are utilized to make dry information interesting, confusing information clear, and to break up large blocks of text. Though originally designed for digital viewing using Adobe InDesign and Illustrator, all designs also take into consideration potential print-at-home requirements.
For more examples of data visualization, visit the Corporate Publications section.
Monthly Statistics

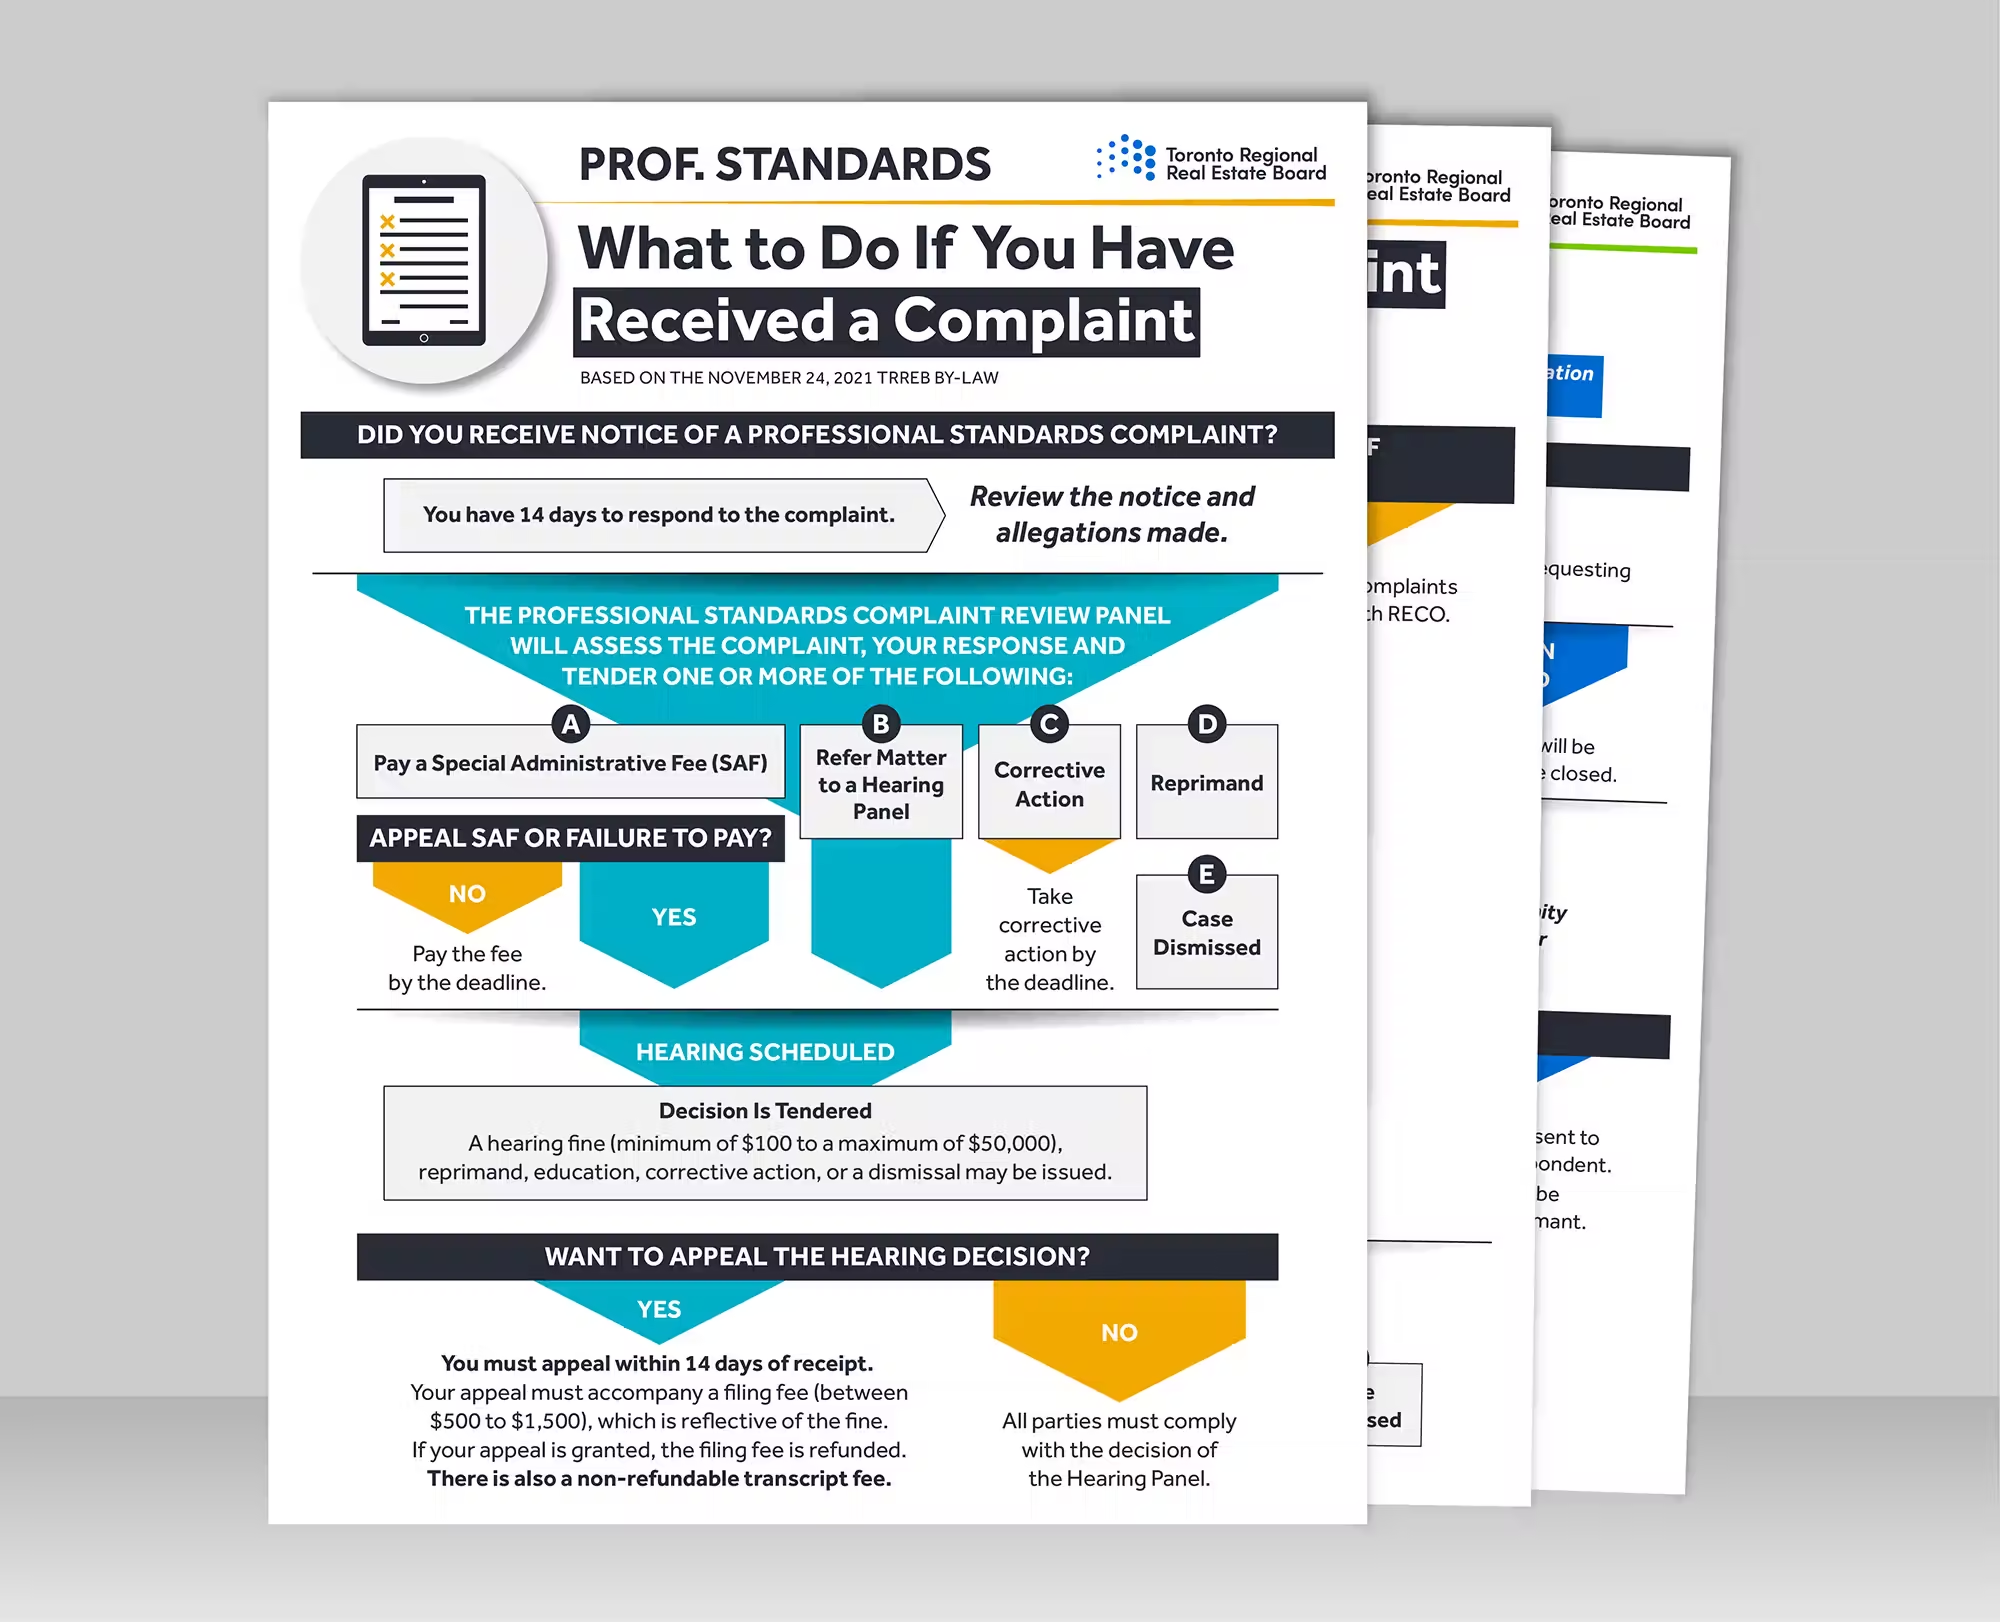
Flow Charts
Policy Briefs

Sponsorship Packages